Gravitational-waves, anisotropies and the large scale structure of the Universe
This blog post is about some recent papers which I led or was a coauthor on, to use gravitational-waves as a probe to measure anisotropies in the universe.
The fundamental idea of cosmology is that we can apply the laws of physics - broadly speaking the general theory of relativity - to the entire universe as a whole. The discovery of the cosmic microwave background (CMB) in the 1950s laid the foundation to observational aspect of cosmology, which hand-in-hand with theory has now given us a detailed picture of our Universe. For instance, we know that that the Universe is expanding at an accelerating rate from an initial very hot, dense state called the Big Bang.
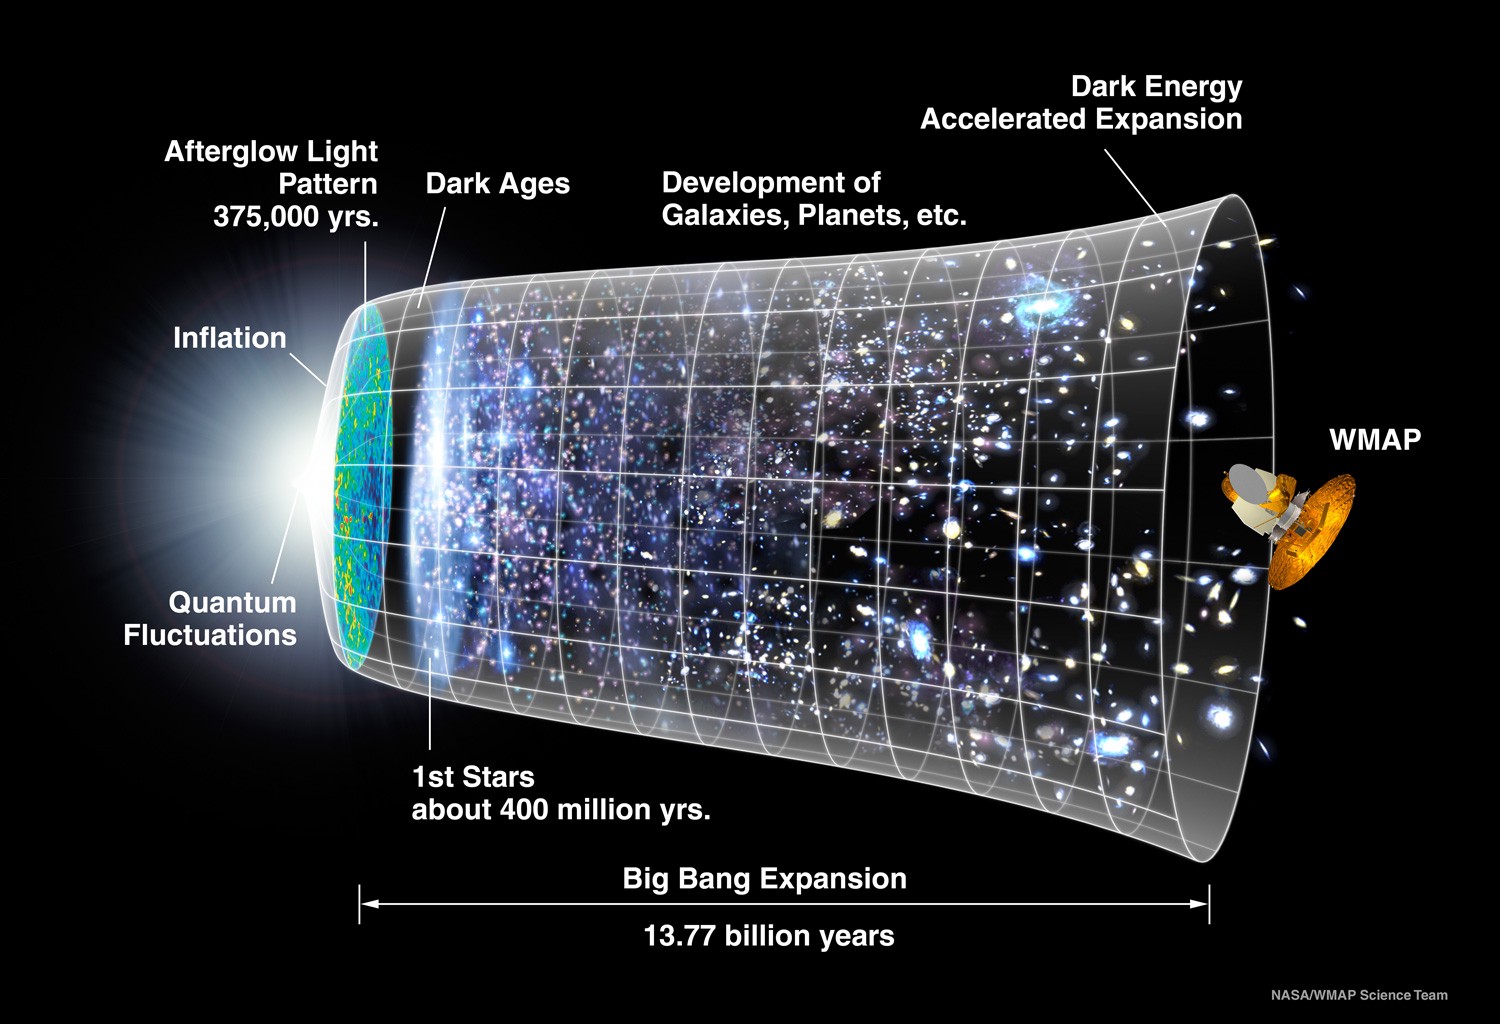
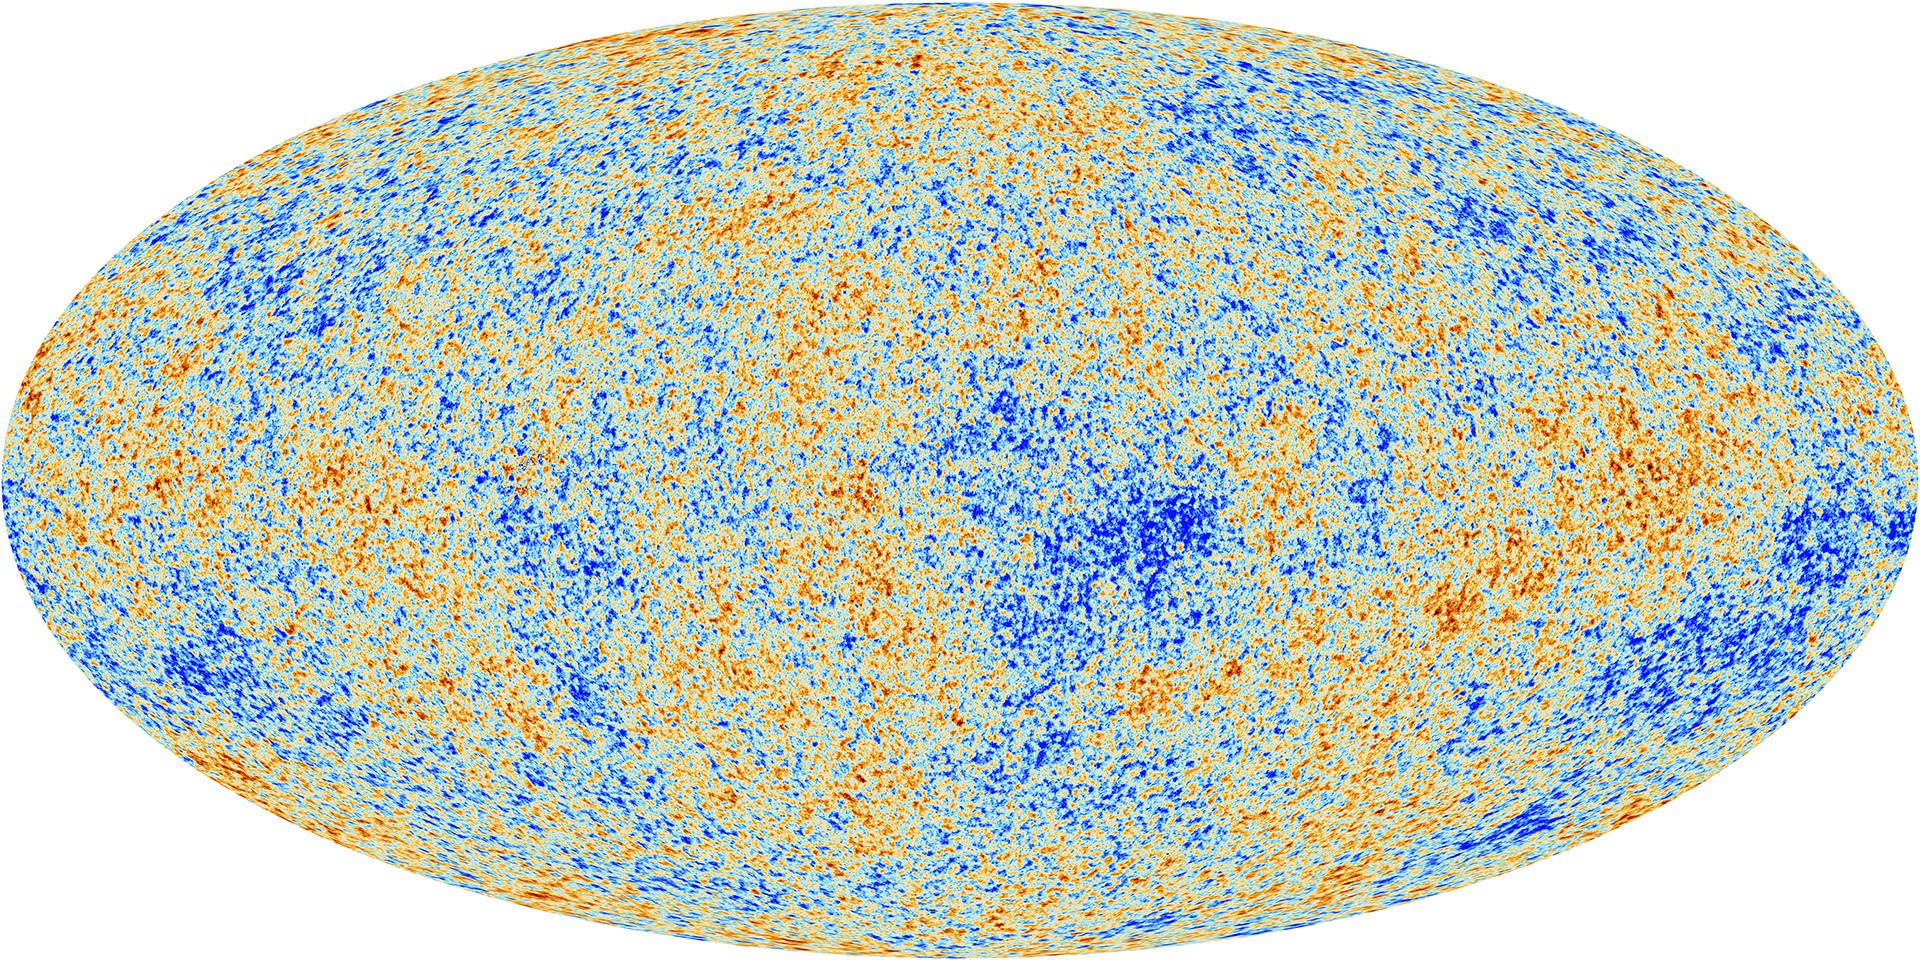
The cosmic microwave background (CMB) is a snapshot of the universe just 380,000 years after the Big-bang and it still remains one of our most important sources for knowledge about cosmology. From modern CMB measurements made by the WMAP and the Planck satellites, we know that the Universe is fairly isotropic - i.e nearly the same in all directions - and homogenous on large scales.
Studies of the CMB are early universe probes of cosmology. One of the tools we can use to study the universe at latter times are galaxy surveys like the Sloan Digital Sky Survey (SDSS). These probes do cosmology by studying the distributions of millions or billions of galaxies. The distribution of galaxies will let us infer the so-called large scale structure of the Universe, which is the combined distribution of matter - dark and baryonic. As one might expect, there is a lot of other other non-cosmological science too which comes out surveys like this. Studying billions of galaxies tends to teach us a thing or two about them.
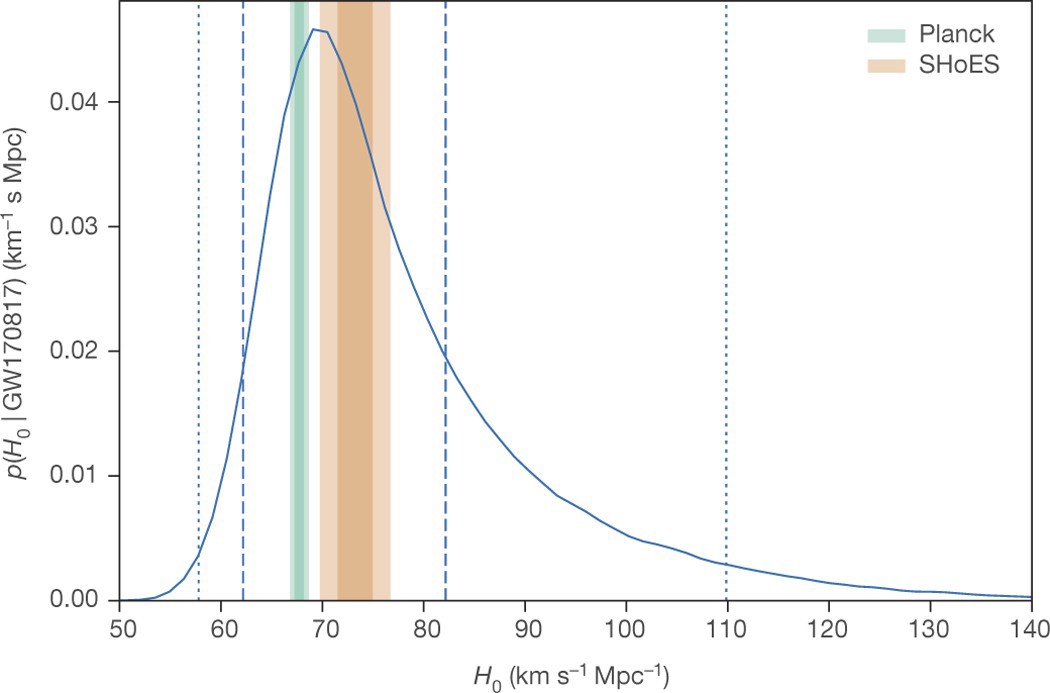
Amongst sciences cosmology is somewhat distinct; we have just one universe. The more independent ways we have to study cosmology the better; that way we can check one against the other. With gravitational-waves opening up a new window into the universe we have a new tool to probe cosmology. This has already happened with the binary neutron star merger GW170817 where the observation of the optical counterpart enabled us to measure the Hubble constant independently of any other ways of measuring it.
With the gravitational-wave detectors getting more sensitive and increasing their reach we can imagine using them to measure the large scale structure, and angular distribution of matter in the Universe. Any extra-galactic sources, or progenitors of gravitational-waves (which are not of early universe origin) should trace the distribution of matter in the universe. The best bet for this are black-hole mergers; we see them the farthest away. The idea then is to use gravitational-waves to build a “map” of the progenitors on the sky and infer from that the matter distribution.
To be fair, this is not a new idea. For example searches for measuring anisotropies in the stochastic background has existed for a while, with the latest limits on anisotropies from the second observing run being the most sensitive so far. While the the stochastic searches are pretty robust, they also make very few assumptions on the nature of the background. One could do better by specifically targeting black-hole (BBH) mergers, by using the results of parameter estimation to draw inferences about the distribution on the sky.
In this paper we trying to specifically do that by using hierarchical Bayesian inference. Normal Bayesian inference relates $p(\lambda| d)$ the probability of parameters $\lambda$ given data $d$ with the probability of data $d$ given parameters $\lambda$ called the likelihood $\mathcal{L}(\lambda | d)$ through the Bayes theorem,
$$p(\lambda | d) \propto \mathcal{L}(d | \lambda) \pi(\lambda) $$
Formally $p(\lambda | d)$ is called the posterior and $\pi(\lambda)$ the prior. But there is more. The shape of the prior can depend on specific population models, in which case we introduce parameters $\Lambda$ to describe the population. This is a hierarchical modeling - because it is modeling the population and not a specific event - and given enough observations we can measure the population parameters $\Lambda$. We can write Bayes theorem for including population parameters by including a prior on them $\pi(\Lambda)$,
$$p(\lambda, \Lambda | d) \propto \mathcal{L}(d | \lambda) \pi(\lambda | \Lambda) \pi(\Lambda) $$
Perhaps not surprisingly, hierarchical Bayesian modeling is used in using observations to study population distributions. For example, in the context of gravitational-waves for example it has been used to study things like the mass and spin distributions of black-holes that LIGO and Virgo saw. In this paper we develop ways to extend hierarchical inference to measure anisotropies, specifically by measuring $N$-point angular correlations.
To understand $N$-point correlations, it is useful to look at a simpler specific case of $N=2$ with two-point correlation. We borrow terminology from the galaxy survey fields, where two-point correlation function $\zeta(\Delta^{mn})$ can be defined the probability function of two galaxies labeled $m, n$ being at an angular separation of $\Delta^{mn}$ on the sky. Similarly for gravitational-waves we define the two-point correlation function $\zeta(\Delta^{mn})$ as the probability function of two BBH labeled $m, n$ occurring at an angular separation of $\Delta^{mn}$ on the sky.
The two-point correlation functions can be written as an expansion of Legendre polynomials which are useful things you might have seen already in electromagnetism or cosmology.
$$ \zeta ( \Delta^{mn} | { C_l} ) = \sum_l (2l +1) C_l \mathcal{P}_l(cos( \Delta^{mn} ))$$
The multipole $l$ determines the angular scale of the anisotropy in question. The lowest coefficient $C_0$ is the isotropic parameter which is the parameter that determines the value constant over the entire sky. The other $l$-values determine anisotropies of the scales of $\theta \sim 2\pi /l$.
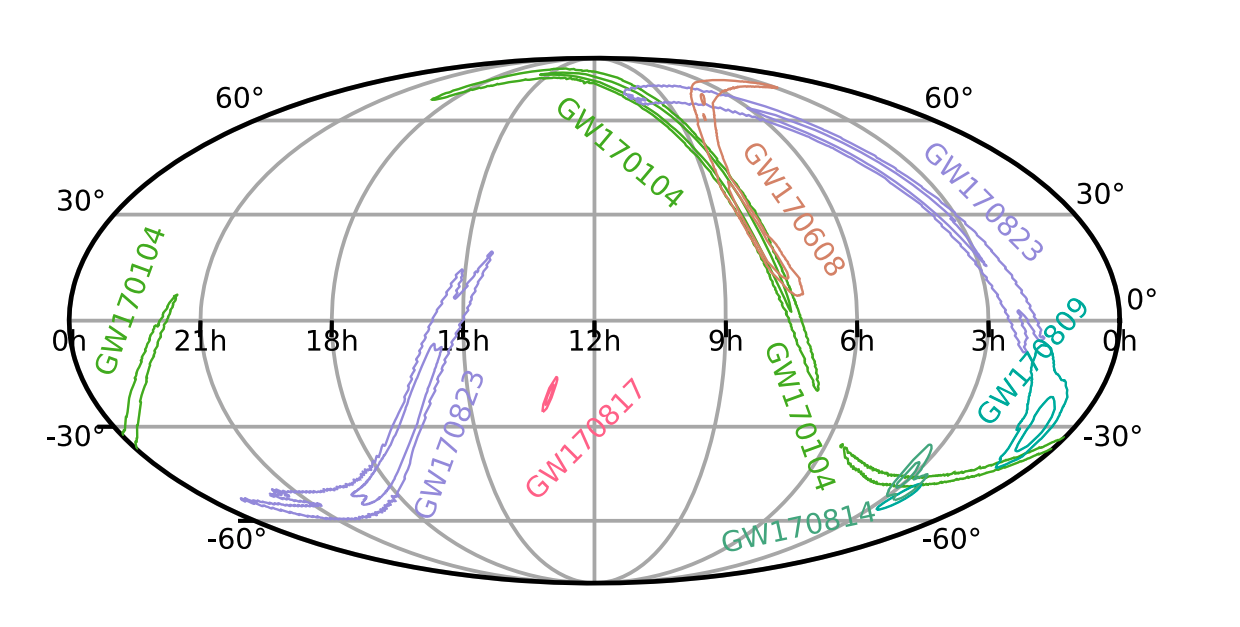
In the language of hierarchical Bayesian inference we apply a prior $\zeta$ which depend on parameters $C_l$ which are measured using the data. In this case the data is of course BBH mergers which can’t be precisely pin-pointed. For example the figure below shows some of the sky localizations of the most confident detections in the second observing run O2, they are huge. In our analysis we actually extend this to sub-threshold signals too. These are signals which are pretty weak and will have much larger uncertainties, but since we have many more of them we can hope to learn something by including them. We are also much less uncertain that these signals are weak, and we use a statistical framework designed to account for this. I will not go into details about it here, but here is a link to the formalism paper if you are curious to learn more.
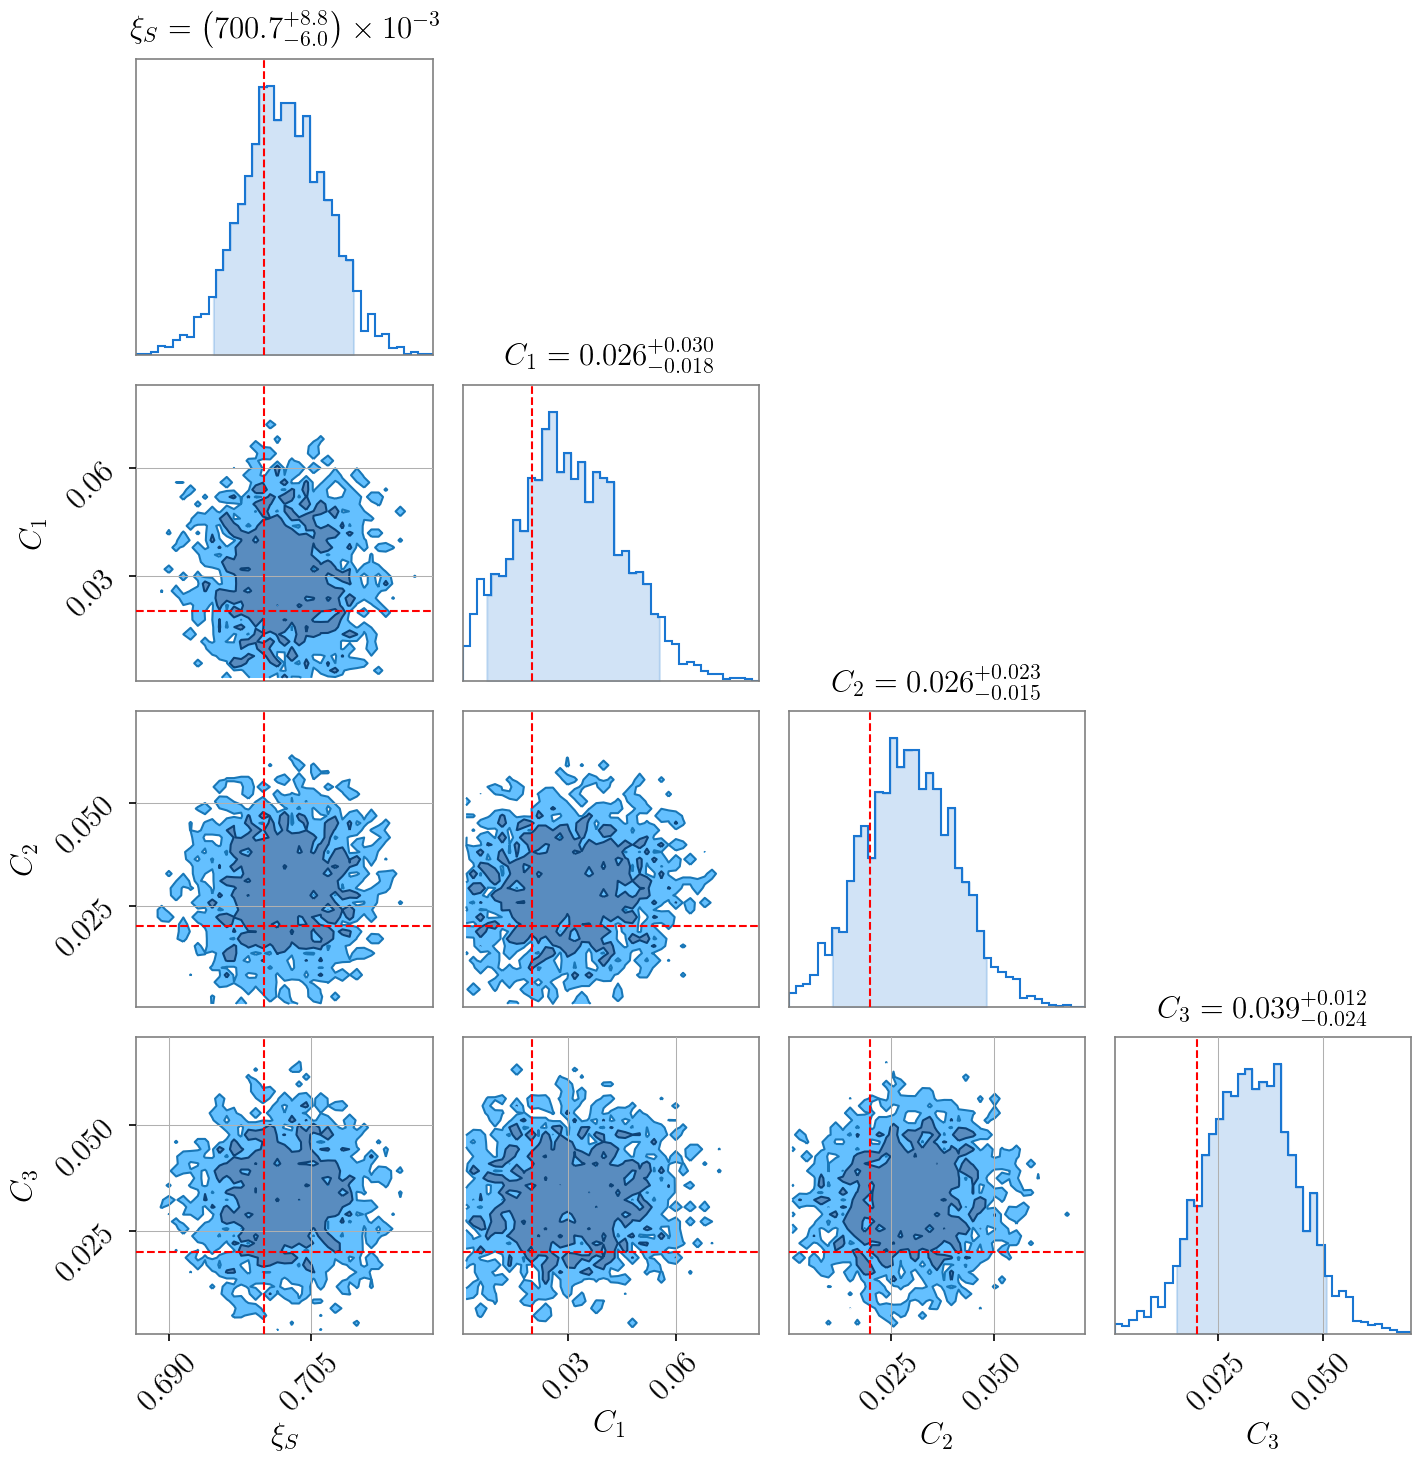
In this we developed a formalism to do precisely that. To validate our methods we simulate a large number of BBH signals distributed in an anisotropic manner (albeit with statistical isotropy) on the sky. And then attempt to recover the $C_l$. The figure below shows what the technique recovers from a simulation. To be clear the $C_l$ values used in this data are larger than potential astrophysical values. To be able to measure smaller $C_l$ values we need to use a larger amount of data.
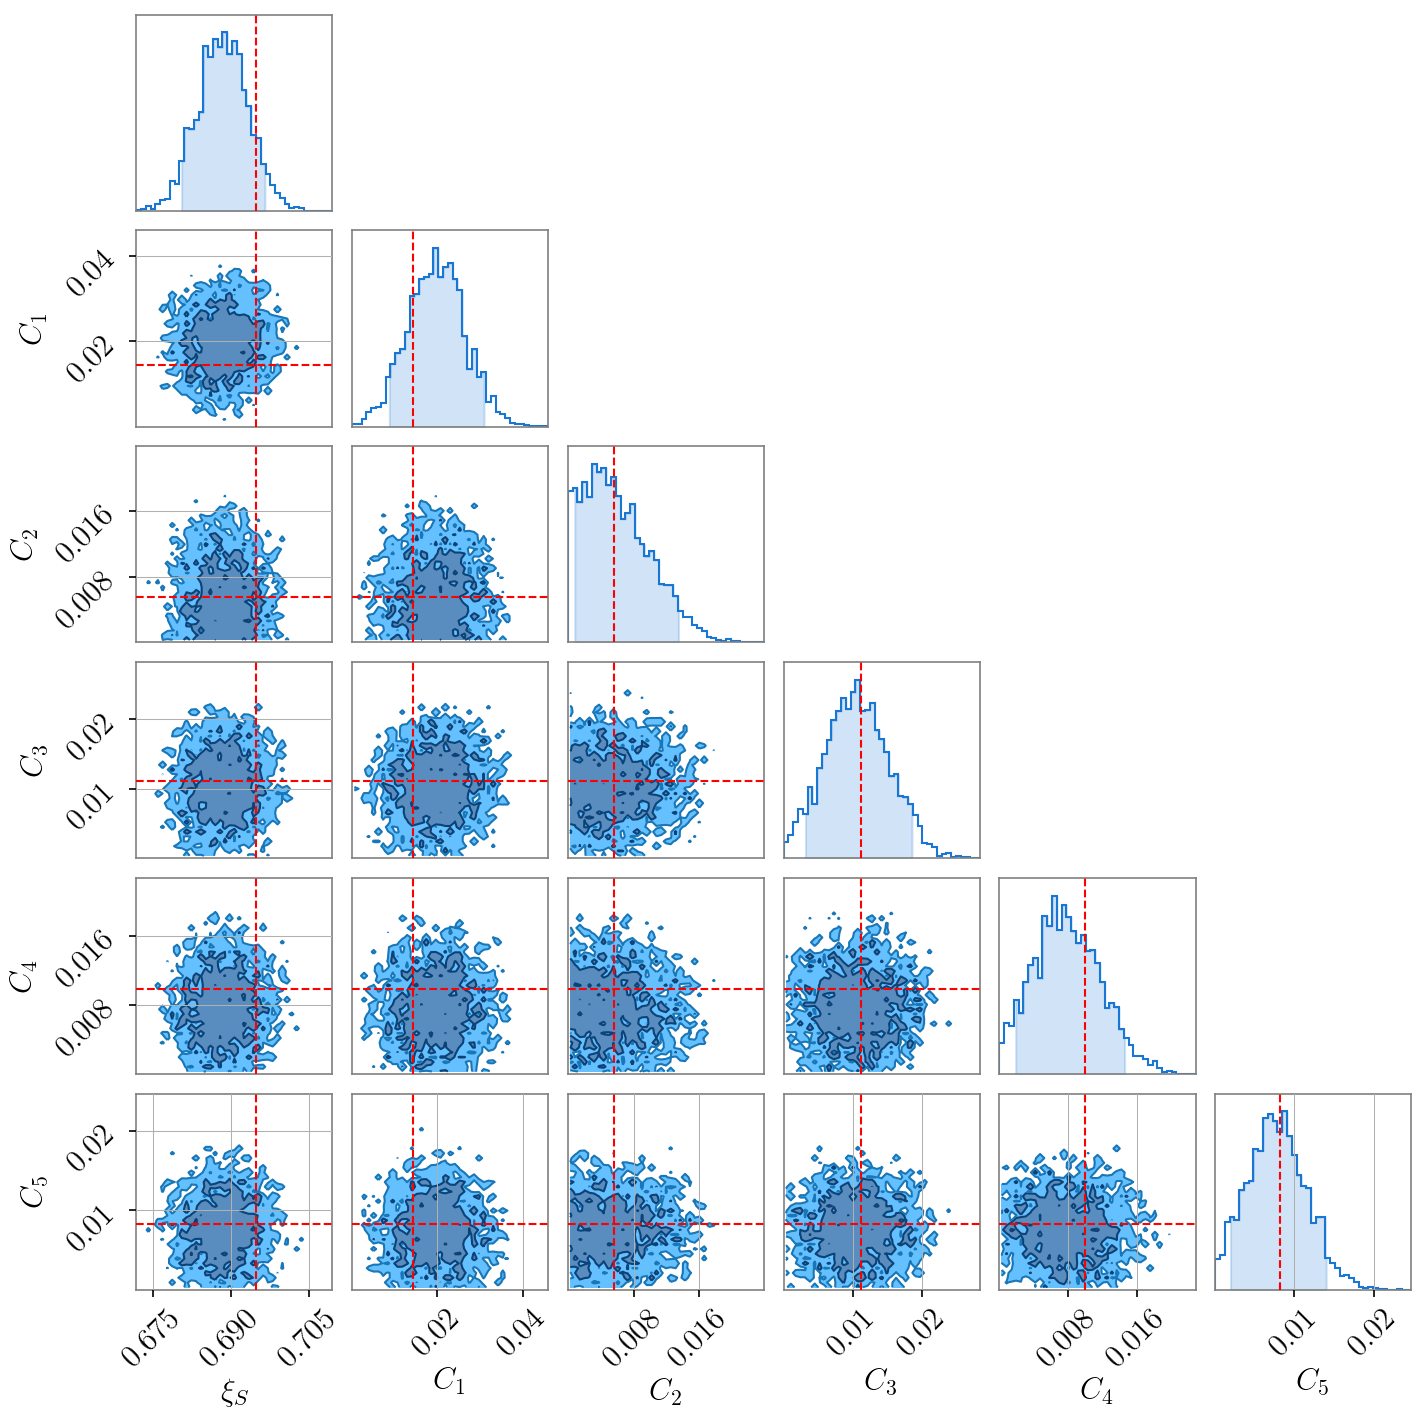
We can also do a similar analysis by ‘correlating’ gravitational-wave signals with external tracers of structure in the universe like galaxy counts. The positions of the galaxies are localized to a much better degree than gravitational-waves, which means we can probe the angular distribution degree than with BBH alone. We demonstrate this again with a simulation the recovery of which is shown below.
I find this to be an exiting new way to use gravitational-waves as tools for cosmology. Using gravitational-waves to trace structure provides with an entirely new way to probe the distribution of matter and ultimately dark matter. One extension I am really excited about is measure 3D correlations as opposed to just angular correlations demonstrated here. There is more to come in this, so keep an eye out for this space!
Dr. Sharan Banagiri
Postdoctoral Associate
I’m a postdoctoral associate at CIERA, Northwestern University working on gravitational waves. I have a PhD in physics from the the University of Minnesota.